The end goal of this blog is to expose the data used to assess my endurance performance. This experiment goes till the Berlin Marathon 2021.
- My weigh and sleeping stats were retrieved from Fitbit.
- My activity stats were retrieved from Garmin Connect.
Weight and Fat Percentage
You can downoad the raw data here!

Weekly Summary
| date_start | date_end | weight_initial | weight_end | weight_avg | weight_delta | weight_avg-initial | fat%_avg |
|---|---|---|---|---|---|---|---|
| 2021-06-27 | 2021-06-21 | 102.6 | 100.9 | 101.428571 | -1.7 | -1.171429 | 28.718572 |
| 2021-07-04 | 2021-06-28 | 101.5 | 99.7 | 100.942857 | -1.8 | -0.557143 | 28.267858 |
| 2021-07-11 | 2021-07-05 | 100.5 | 98.1 | 99.783333 | -2.4 | -0.716667 | 27.240334 |
| 2021-07-18 | 2021-07-12 | 99.6 | 99.8 | 99.142857 | 0.2 | -0.457143 | 26.135000 |
| 2021-07-13 | 2021-07-19 | 99.9 | 98.9 | 99.042857 | -1.0 | -0.857143 | 26.122429 |
| 2021-07-20 | 2021-07-26 | 98.5 | 97.2 | 97.728571 | -1.3 | -0.771429 | 26.446714 |
| 2021-07-27 | 2021-08-02 | 97.5 | 97.5 | 97.228571 | 0.0 | -0.271429 | 26.202714 |
| 2021-08-03 | 2021-08-09 | 96.6 | 97.0 | 96.771429 | 0.4 | 0.171429 | 25.925571 |
| 2021-08-10 | 2021-08-16 | 95.1 | 96.1 | 95.450000 | 1.0 | 0.350000 | 24.622000 |
Long Runs - Pace

Remember:
- total time 4h:00m -> pace 5:41
- total time 4h:30m -> pace 6:23
- total time 5h:00m -> pace 7:06
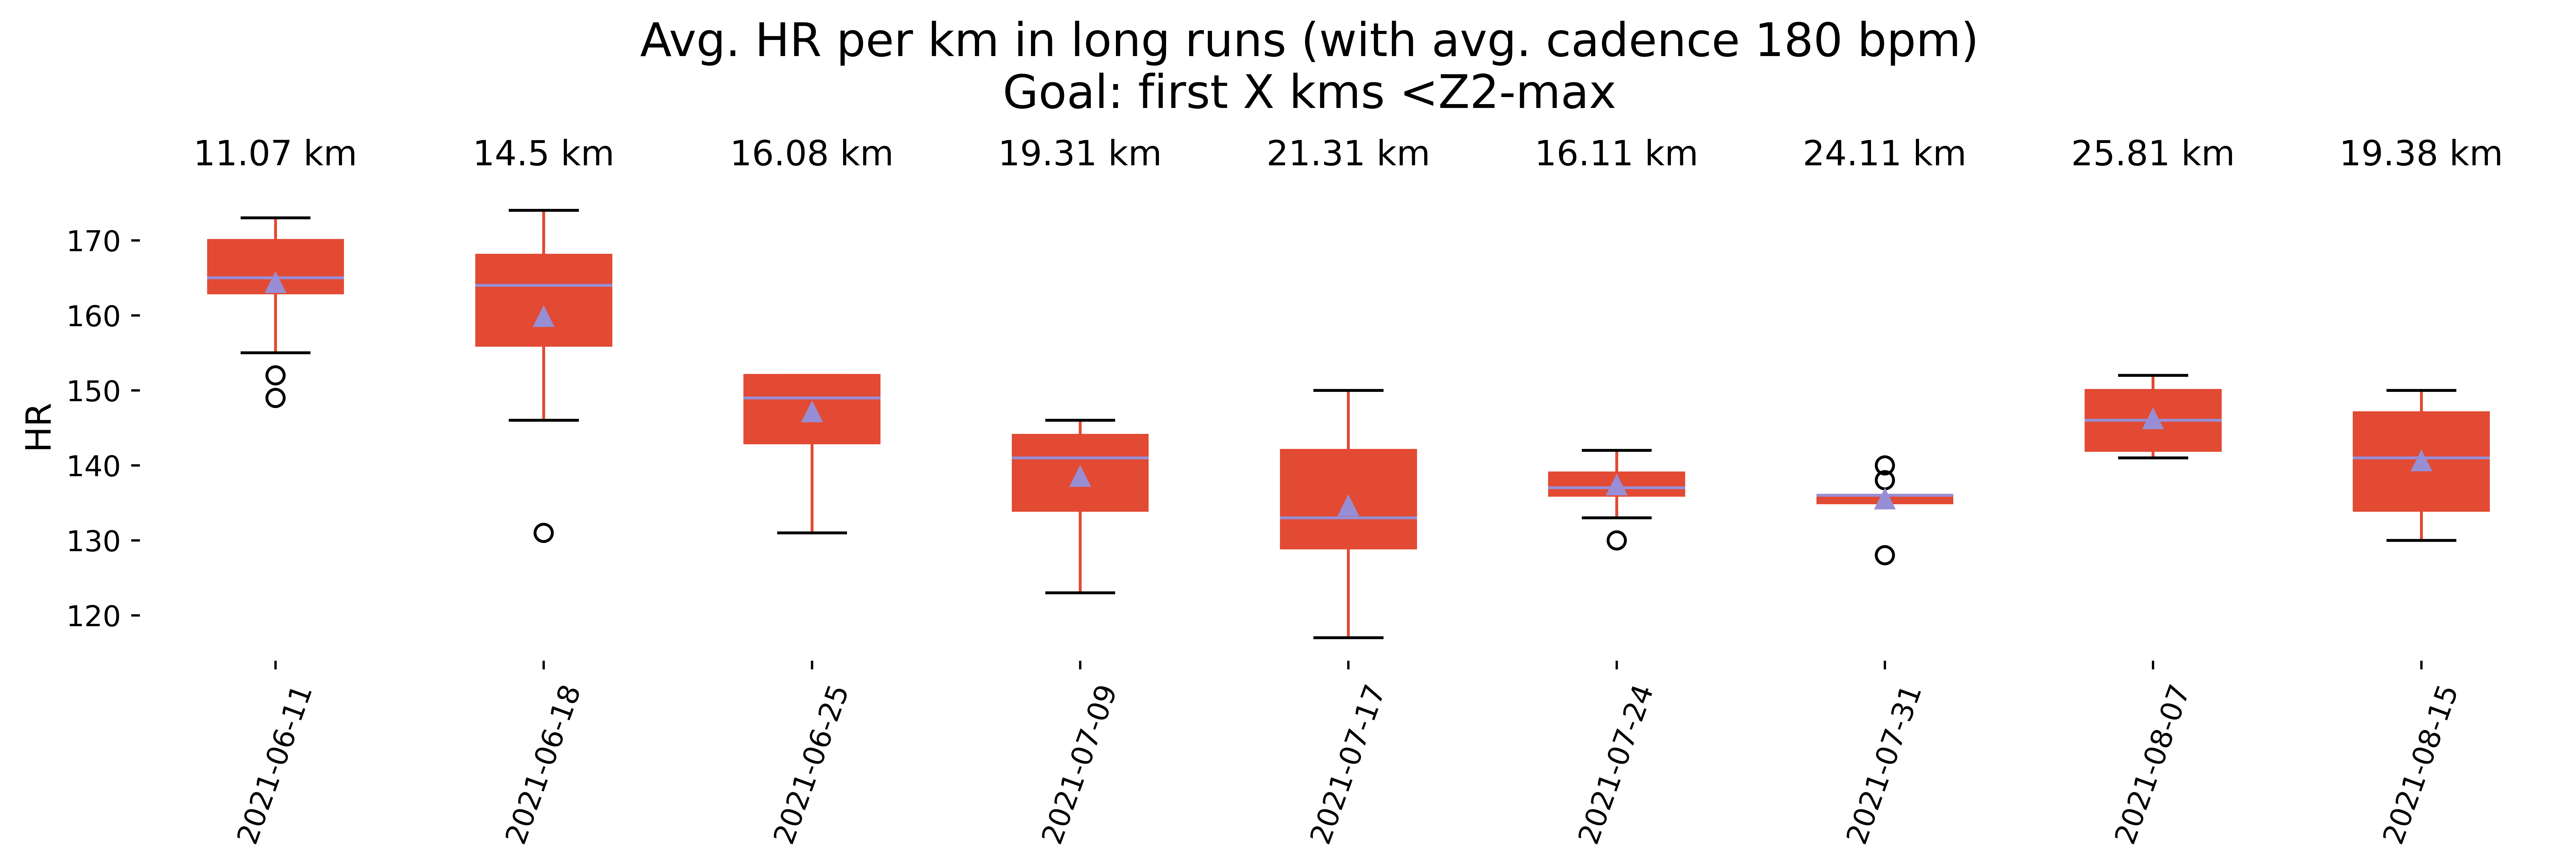
Long Runs - HR

Remember:
- Z1: [95, 114[ (50-60%)
- Z2: [114, 133[ (60-70%)
- Z3: [133, 152[ (70-80%)
- Z4: [152, 171[ (80-90%)
- Z5: [171, 190[ (90-100%)
Food Intake Race Day
- You can downoad the expected intake table here!
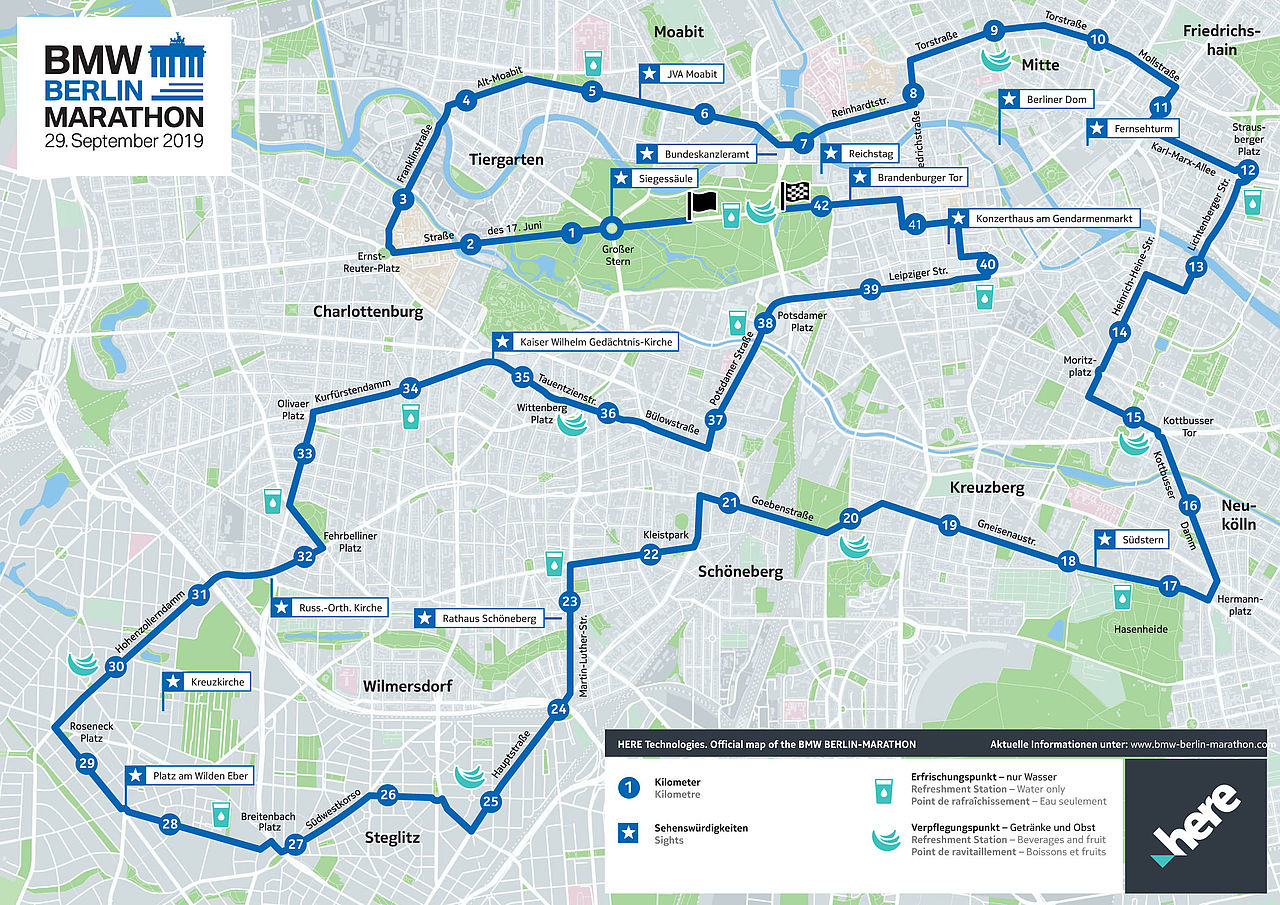
The parcour
